An R interface to jExcel library to create web-based interactive tables and spreadsheets compatible with Excel or any other spreadsheet software.
To install the stable CRAN version:
install.packages('excelR')To install the latest development version from GitHub:
library(devtools)
install_github('Swechhya/excelR')
Usage
Getting Started
Excel tables can be created using excelTable function as shown below:
library(excelR)

data = data.frame(A =c (1:5), B = c(LETTERS[1:5]))

excelTable(data=data)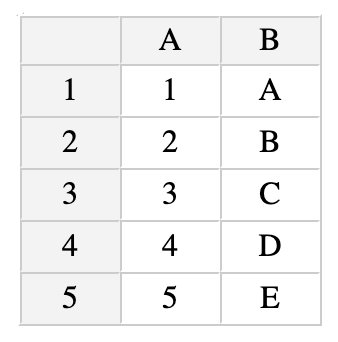
Basic Usage
library(excelR)

 data = data.frame(Model = c('Mazda', 'Pegeout', 'Honda Fit', 'Honda CRV'),
                   Date=c('2006-01-01', '2005-01-01','2004-01-01', '2003-01-01' ),
                   Availability = c(TRUE, FALSE, TRUE, TRUE))

 columns = data.frame(title=c('Model', 'Date', 'Availability'),
                      width= c(300, 300, 300),
                      type=c('text', 'calendar', 'checkbox'))
 excelTable(data=data, columns = columns)
Features
This documentation gives example for following features:
- Different types of columns
- Row and column resizing
- Drag and drop rows and columns
- Merge rows and columns
- Nested headers
- Pagination
- Search
- Excel formulas
- Style
- Automated Column Types
- Toolbar
- Shiny Integration
Different types of columns
- Calendar
library(excelR)

data = data.frame(Model = c('Mazda', 'Pegeout', 'Honda Fit', 'Honda CRV'),
                  Date=c('2006-01-01', '2005-01-01','2004-01-01', '2003-01-01' ))

columns = data.frame(title=c('Model', 'Date' ),
                     width= c(300, 300),
                     type=c('text', 'calendar'))
excelTable(data=data, columns = columns)
- Checkbox
library(excelR)

 data = data.frame(Model = c('Mazda', 'Pegeout', 'Honda Fit', 'Honda CRV'),
                   Availability = c(TRUE, FALSE, TRUE, TRUE))

 columns = data.frame(title=c('Model', 'Availability'),
                      width= c(300, 300),
                      type=c('text', 'checkbox'))
 excelTable(data=data, columns = columns)
- Dropdown
library(excelR)

 data = data.frame( Make = c('Honda', 'Honda', 'Hyundai'),
          Car = c('Civic', 'City', 'Polo'))

 columns = data.frame(title=c('Make', 'Car'),
                      width= c(300, 300),
                      type=c('text', 'dropdown'),
                      source=I(list(0,c('Civic', 'City',  'Polo', 'Creta', 'Santro'))))
 excelTable(data=data, columns = columns)
- Radio
library(excelR)

 data = data.frame(Model = c('Mazda', 'Pegeout', 'Honda Fit', 'Honda CRV'),
                   Choice = c(FALSE, FALSE, FALSE, TRUE))

 columns = data.frame(title=c('Model', 'Choice'),
                      width= c(300, 300),
                      type=c('text', 'radio'))
 excelTable(data=data, columns = columns)
- Color
library(excelR)

 data = data.frame(Model = c('Mazda', 'Pegeout', 'Honda Fit', 'Honda CRV'),
                   Color= c('red', 'blue', 'yellow', 'black'))

 columns = data.frame(title=c('Model', 'Color'),
                      width= c(300, 300),
                      type=c('text', 'color'),
                      render=c(0, 'square'))
 excelTable(data=data, columns = columns)
- Image
library(excelR)

data <- data.frame(Title = c("Paul Parker", "Mark Ellen"),
                   Cover =  c("https://marketplace.canva.com/MACcZp2p4po/2/0/thumbnail_large/canva-black-white-acoustic-album-cover-MACcZp2p4po.jpg",                          "https://marketplace.canva.com/MACcY55adP4/1/0/thumbnail_large/canva-black-and-white-masculine-acoustic-modern-album-cover-MACcY55adP4.jpg"))

columns <- data.frame(title = colnames(data),
                      type = c("text", "image"),
                      width = c(120, 200))

excelTable(data = data, columns = columns)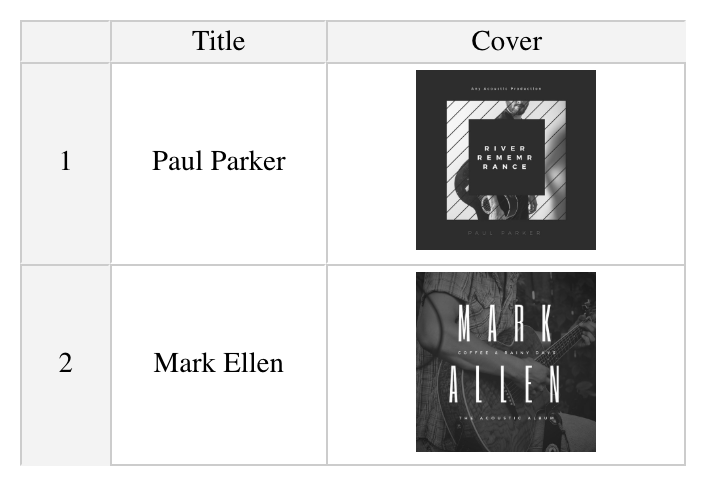
Row and Column Resizing
library(excelR)

 data = data.frame(Model = c('Mazda', 'Pegeout', 'Honda Fit', 'Honda CRV'),
                   Date=c('2006-01-01', '2005-01-01','2004-01-01', '2003-01-01' ),
                   Availability = c(TRUE, FALSE, TRUE, TRUE))

 columns = data.frame(title=c('Model', 'Date', 'Availability' ),
                      width= c(300, 300, 300),
                      type=c('text', 'calendar', 'checkbox'))
 excelTable(data=data, columns = columns, rowResize = TRUE)
Drag and Drop Rows and Columns
library(excelR)

 data = data.frame(Model = c('Mazda', 'Pegeout', 'Honda Fit', 'Honda CRV'),
                   Date=c('2006-01-01', '2005-01-01','2004-01-01', '2003-01-01' ),
                   Availability = c(TRUE, FALSE, TRUE, TRUE))

 columns = data.frame(title=c('Model', 'Date', 'Availability' ),
                      width= c(300, 300, 300),
                      type=c('text', 'calendar', 'checkbox'))
 excelTable(data=data, columns = columns, rowDrag = TRUE, columnDrag = TRUE)
Merge Rows and Columns
library(excelR)

data = data.frame( Make = c('Honda', 'Honda', 'Hyundai'),
                   Car = c('Civic', 'City', 'Creta'))

 columns = data.frame(title=c('Make', 'Car'), width= c(300, 300))

excelTable(data=data, columns = columns,  mergeCells = list(A1=c(1,2)))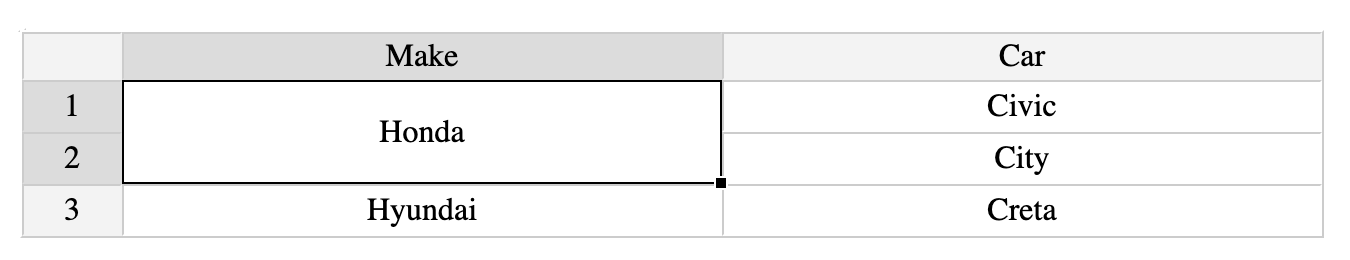
Nested Headers
library(excelR)

 columns = data.frame(title=c('Sepal Length', 'Sepal Width', 'Petal Length','Petal Width', 'Species'),
                      width= c(200, 200, 200, 200, 200))

 nestedHeaders = list( data.frame(title=c("Plant Attribute"), colspan=c(5)),
                       data.frame(title=c("Sepal Attributes", "Petal Attributes", "Species"),
                                  colspan=c(2, 2, 1)))
 excelTable(data=head(iris), columns = columns, nestedHeaders = nestedHeaders)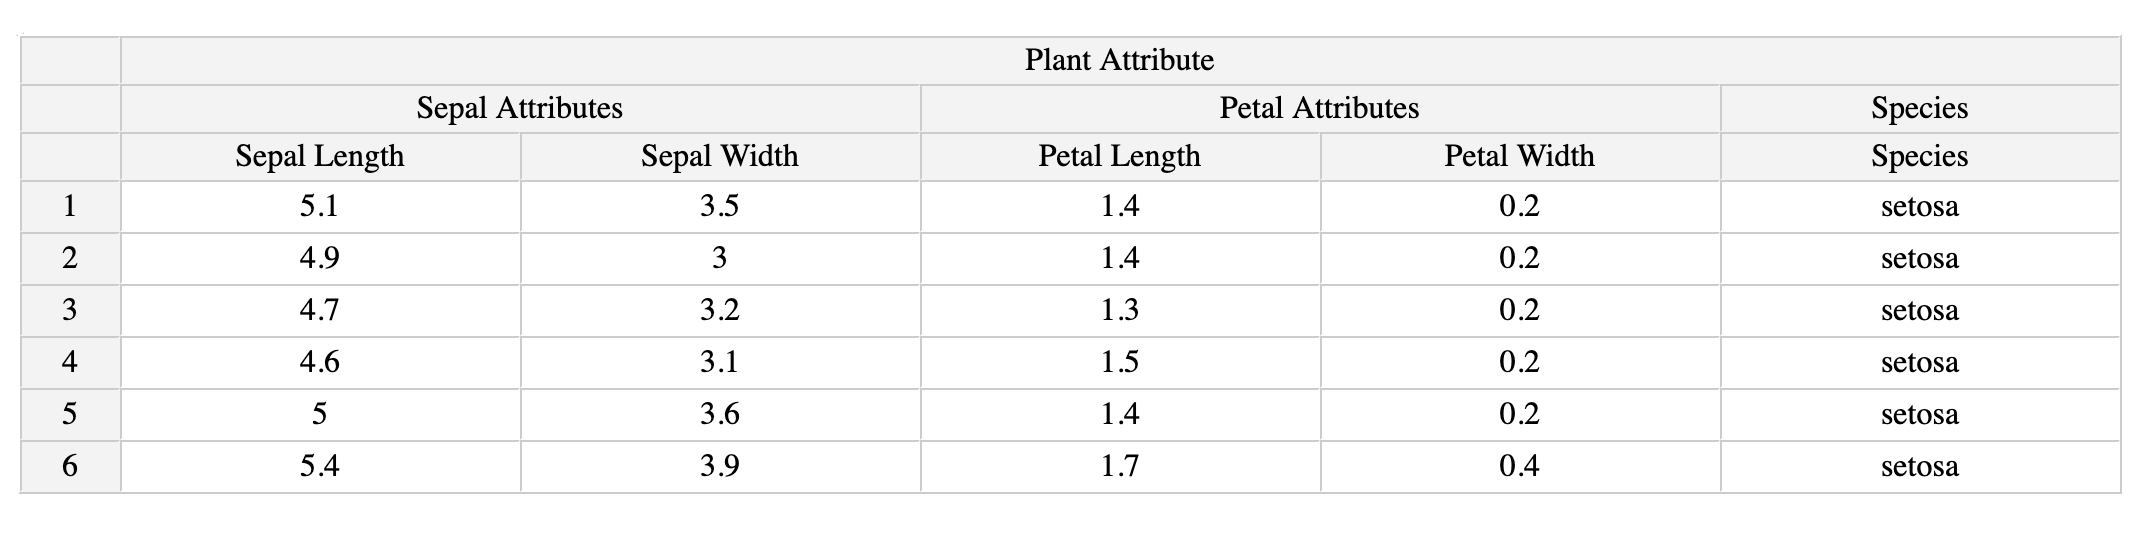
Pagination
library(excelR)

 columns = data.frame(title=c('Sepal Length', 'Sepal Width', 'Petal Length','Petal Width', 'Species'),
                      width= c(200, 200, 200, 200, 200))

 excelTable(data = iris, columns = columns, pagination=10)
Search
library(excelR)

 columns = data.frame(title=c('Sepal Length', 'Sepal Width', 'Petal Length','Petal Width', 'Species'),
                      width= c(200, 200, 200, 200, 200))

 excelTable(data = iris, columns = columns, search=TRUE)
Excel formulas
library(excelR)

 columns = data.frame(title=c('Sepal Length', 'Sepal Width', 'Petal Length','Petal Width', 'Species'),
                      width= c(200, 200, 200, 200, 200))

 excelTable(data=head(iris), columns = columns, minDimension = c(5, 7))
Style
Styling in version 0.1.0:
 library(excelR)

 data = data.frame( Make = c('Honda', 'Honda', 'Hyundai'),
                   Car = c('Civic', 'City', 'Creta'))

 columns = data.frame(title=c('Make', 'Car'), width= c(300, 300))

 style = list(A1=c('background-color:orange', 'color:green'),
              B1=c('background-color:orange', 'color:green'))

 excelTable(data=data, columns = columns, style = style)
Styling from version 0.2.0 onwards:
 library(excelR)

 data = data.frame( Make = c('Honda', 'Honda', 'Hyundai'),
                   Car = c('Civic', 'City', 'Creta'))

 columns = data.frame(title=c('Make', 'Car'), width= c(300, 300))

 style = list(A1='background-color:orange; color:green;',
              B1='background-color:orange; color:green;')

 excelTable(data=data, columns = columns, style = style)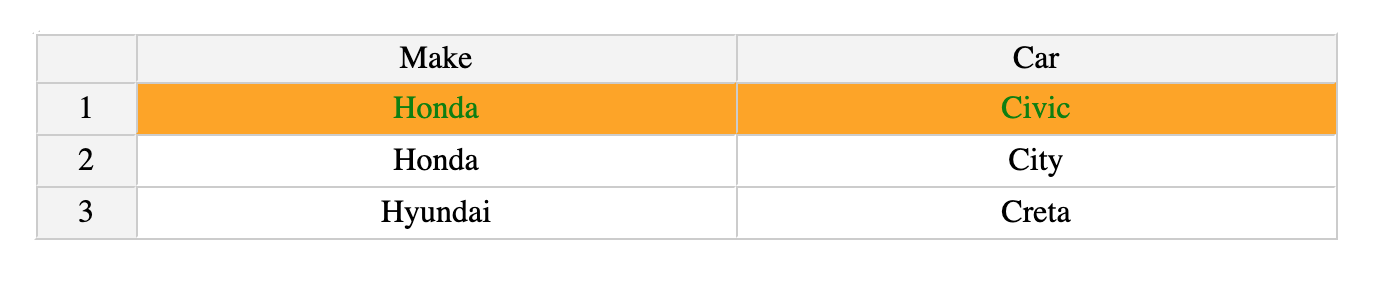
Automated Column Types
library(excelR)

 data = data.frame(Model = c('Mazda', 'Pegeout', 'Honda Fit', 'Honda CRV'),
                   Date=c(as.Date('2006-01-01'), as.Date('2005-01-01'), as.Date('2004-01-01'), as.Date('2003-01-01') ),
                   Availability = c(TRUE, FALSE, TRUE, TRUE), stringsAsFactors = FALSE)

 columns = data.frame(title=c('Model', 'Date', 'Availability' ),
                      width= c(300, 300, 300))
 excelTable(data=data, columns = columns)
Toolbar
library(excelR)

 data = data.frame(Model = c('Mazda', 'Pegeout', 'Honda Fit', 'Honda CRV'),
                   Date=c('2006-01-01', '2005-01-01','2004-01-01', '2003-01-01' ))

 columns = data.frame(title=c('Model', 'Date'),
                      width= c(200, 200),
                      type=c('text', 'calendar'))
 excelTable(data=data, columns = columns, showToolbar=TRUE)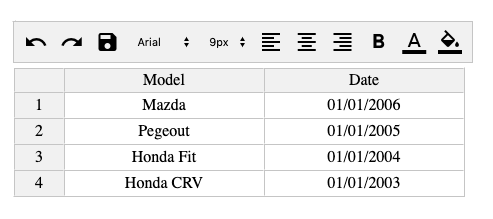
Shiny Integration
Creating excel table in Shiny
  library(shiny)
  library(excelR)

   shinyApp(
     ui = fluidPage(excelOutput("table")),
     server = function(input, output, session) {
       output$table <-
      renderExcel(excelTable(data = head(iris)))
      }
    )
Reading changed data from excel table in Shiny
  library(shiny)
  library(excelR)

   shinyApp(
     ui = fluidPage(excelOutput("table")),
     server = function(input, output, session) {
       output$table <-
      renderExcel(excelTable(data = head(iris)))
      observeEvent(input$table,{
        table_data <- excel_to_R(input$table)
        if(!is.null(table_data)){
        print(table_data)
        }

      })
      }
    )
Getting/Setting comment in Shiny
library(excelR)
library(shiny)

shinyApp(

  ui = fluidPage(actionButton('set', 'Set Comments to cell A1'),
                 actionButton('get', 'Get Comments from cell A1'),
                 textAreaInput("fetchedComment", "Comments from A1:"),
                 excelOutput("table", height = 175)),

  server = function(input, output, session) {

      output$table <- renderExcel(excelTable(data = head(iris), allowComments = TRUE))

      # Set the comment
      observeEvent(input$set,{
        setComments("table", "A1", "This is a comment")
      })

      # Get the comment
      observeEvent(input$get,{
          getComments("table", "A1")
      })

      # Print the comment to the text area
      observeEvent(input$table,{
        updateTextAreaInput(session, 'fetchedComment', value = input$table$comment )
      })
    }
  )
Getting table data in Shiny
library(excelR)
library(shiny)

shinyApp(

  ui = fluidPage(actionButton('get', 'Get table data'),
                 tableOutput("fetchedData"),
                 excelOutput("table", height = 175)),

  server = function(input, output, session) {

    output$table <- renderExcel(excelTable(data = head(iris)))

    # Get the table data
    observeEvent(input$get,{
      getTableData("table")
    })

    # Print the table
    observeEvent(input$table,{
      output$fetchedData <- renderTable(excel_to_R(input$table))
    })
  }
)
Getting selected data in Shiny
library(excelR)
library(shiny)

shinyApp(

  ui = fluidPage( tags$h6("Selected Data:"),
                  tableOutput("selectedData"),
                  tags$h6("Excel Table:"),
                 excelOutput("table", height = 175)),

  server = function(input, output, session) {

    output$table <- renderExcel(excelTable(data = head(iris), getSelectedData = TRUE))

    # Print the selected data in table
    observeEvent(input$table,{
      output$selectedData <- renderTable(get_selected_data(input$table))
    })
  }
)